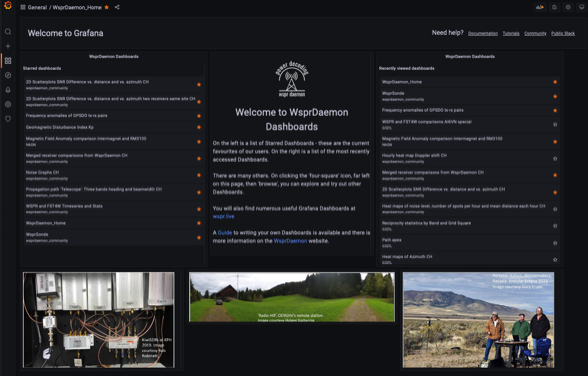
Grafana is a powerful graphing tool with a built-in interface to TimescaleDB, ClickHouse and many other databases. We have a WsprDaemon Grafana Home Page, as shown below, from which many pre-built dashboards can be accessed. Starred dashboards on the left are the most commonly accessed. Others that have been recently viewed appear on the right. On the toolbar on the far left the entire suite of dashboards can be browsed by clicking the four-box icon. Our Guide to Grafana Dashboards may be of help.
If you are a new user you will use log on credentials: wdread and JTWSPR2008
Note that some TimescaleDB dashboards may take quite some time to load the pull-down options. ClickHouse dashboards (those ending CH) are invariably faster.
Many other useful Grafana Dashboards - all ClickHouse - are available on Arne's wspr.live GUI page.

Grafana
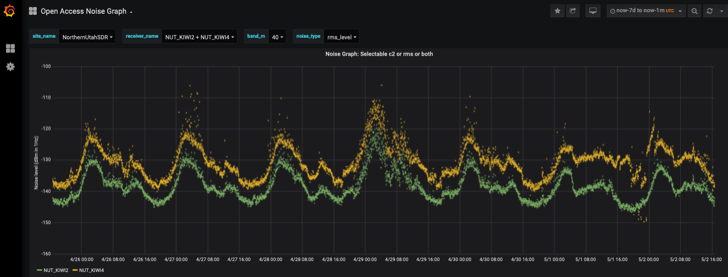
Below is our first dashboard - noise level - from 2020 that kicked off WsprDaemon's use of Grafana.
WsprDaemon
Robust decoding and reporting for WSPR FST4W FT8 FT4 WWV WWVH CHU